收入报告
The Odoo Events application creates custom reports, based on event-related data and analytics. These reports can either be focused on Attendees or Revenues.
The following documentation focuses on the reporting options related to event Revenues.
Revenues reporting page
To access the Attendees reporting page, navigate to .
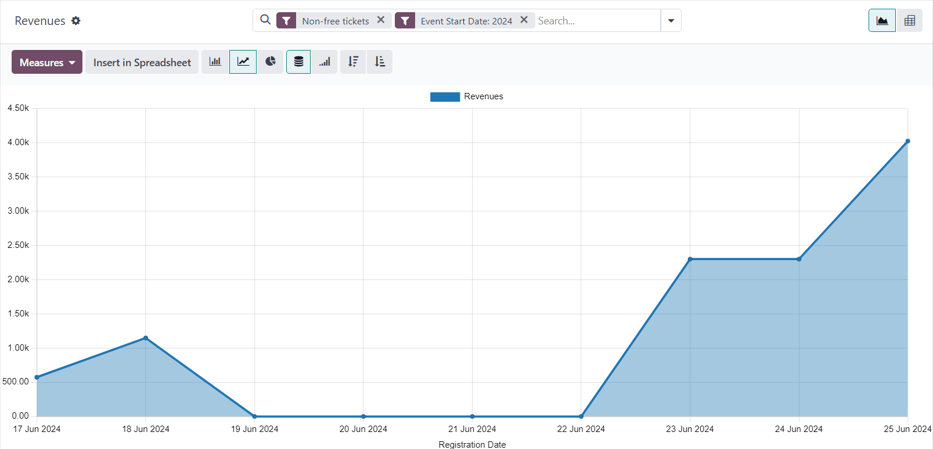
默认情况下,收入 报告页面以图表形式显示( (折线图)`和:icon:`fa-database (堆叠)`数据)。搜索栏中有默认筛选器 :guilabel:`非免费门票 和 活动开始日期:(当年)。
小技巧
要了解有关各种图表视图(和图表视图选项)的更多信息,请参阅 图表视图 文档。
点击右上角的 :icon:`oi-view-pivot`(透视)`图标,还可将 :guilabel:`收入` 报告页面作为 数据透视表 查看。
计量值
选择特定的 指标 是一种快速自定义报告页面的方法。
无论选择哪种视图,收入 报告页面上的衡量指标如下: 收入、免税收入 和 计数。
注解
在 收入 报告页面的默认图表视图中,指标 下拉菜单中只设置了 收入 选项。
In graph view, only one of the Measures can be selected at a time.
When the pivot option is selected, all Measures options are selected, by default.
Revenues: shows the revenues generated from events.
Untaxed Revenues: shows the untaxed revenues generated from events.
Count: shows the total amount of registrants who attended events.
Filters and grouping options
To reveal a drop-down menu of filter and grouping options to create custom reports, click the (down arrow) to the right of the search bar.
Doing so opens a drop-down mega menu of options organized into columns: Filters, Group By, and Favorites.
注解
If a time-related option has been selected from the Filters column (e.g. the default Event Start Date: (year) filter), a Comparison column appears, with comparison options for the corresponding time-related filter option selected.
Only one selection can be made from the Comparison column at a time.
更多内容
Filter options
In the Filters column of the drop-down mega menu, there are various event-related options that can be utilized to create custom reports, based on a number of specific criteria.
Multiple options in the Filters column can be selected at once.
The Filters column has the following options:
Non-free tickets: event tickets/registrations that were not free.
Free: event tickets/registrations that were free.
Pending payment: event tickets/registrations that were purchased, but still have payment pending.
Sold: event tickets/registrations that have been successfully sold (and paid for).
Registration Date: Click the (down arrow) icon to reveal a list of month, quarter, and year options. Select any number of these options to view a specific periods of time and see how many registrations happened during that time.
Upcoming/Running: include revenue-related information for events that are either currently running or are going to happen in the future.
Past Events: include revenue-related information for events that have already taken place.
活动开始日期:点击 (向下箭头) 图标,显示月、季度和年选项列表。选择任意数量的这些选项来指定事件开始日期,以用作收入相关活动数据的筛选器。
活动结束日期:点击 (向下箭头) 图标,显示月、季度和年选项列表。从这些选项中任意选择一个指定活动结束日期,作为收入相关活动数据的筛选器。
已发布活动:选择此选项可显示已发布活动的收入相关数据。
添加自定义筛选器:创建自定义筛选器来分析与活动相关的收入数据。要了解更多信息,请参阅 自定义筛选器 文档。
按选项分组
在 分组方式 列的下拉菜单中,有各种与活动相关的选项,用于创建自定义数据分组。
可同时选择多个 分组方式 选项。
分组方式 列有以下选项:
活动类型:根据活动类型对数据进行分组。
活动:将数据组织成单个组,按活动分隔。
产品:根据活动注册产品对数据进行分组。
门票:根据参与者购买的活动门票类型分组数据。
注册状态:根据注册状态对数据进行分组。
销售订单状态:根据与事件相关的销售订单状态对数据进行分组。
客户:根据客户记录对数据进行分组。
添加自定义分组:点击 (向下箭头) 图标,显示分组选项的下拉列表。要选择一个,请点击所需的选项,Odoo 会将其添加到 分组方式 列。可进行多个选择。
报告样本:活动门票分析(图表)
下面的示例说明了各种筛选器和分组选项如何创建有用的活动收入分析图表报告。在本例中,配置显示了已发布活动的已售或免费门票数据,指标按门票类型和活动分列。
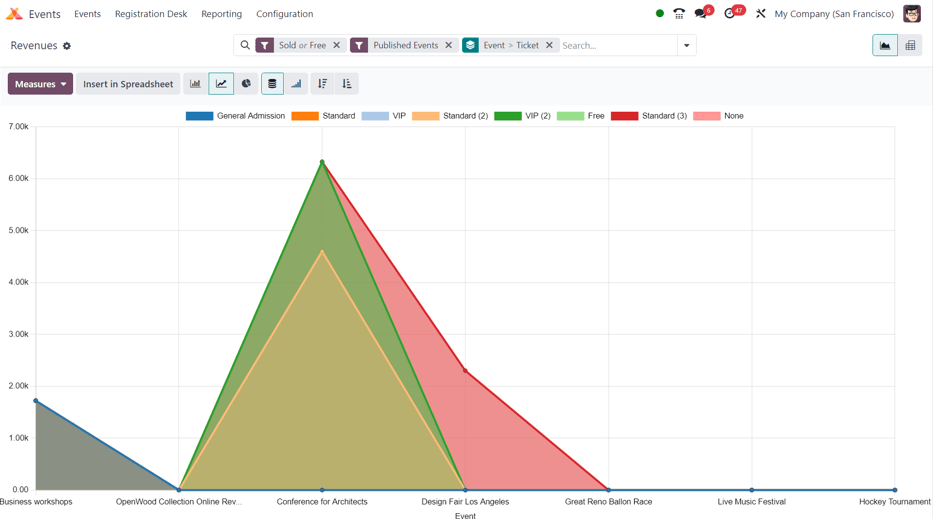
要创建此类报告,请导航至 。保留默认图表视图,但删除搜索栏中的默认筛选器。
然后,点击搜索栏右侧的 ,显示包含筛选和分组选项的下拉菜单。
在此处,从 筛选 列中选择 免费 和 已售 。
然后,由于**只想**查看与已发布活动相关的数据,因此也在 筛选 列中选择 已发布活动 选项。
接下来,在:guilabel:分组方式`列中,按顺序选择 :guilabel:`活动`和 :guilabel:`门票 选项。这样做首先是按活动分组,*然后*是按门票类型分组,从而提供更有用的数据进行分析。
重要
在 分组方式 列中选择选项的顺序会直接影响数据在报告中的显示方式。
在此处,还可以根据需要添加其他配置,以获得更详细的数据。
如果没有添加其他筛选器或分组,Odoo 会以图形方式显示与*已发布活动*的所有*免费*或*已售出*门票相关的数据,按*活动*分组,并按*门票*类型组织。
报告示例:活动类型分析(数据透视表)
下面的示例说明了各种筛选器和分组选项如何创建有用的活动收入分析透视表报告。在本例中,配置文件提供了不同活动类型产生的收入数据,以衡量哪些活动最赚钱。
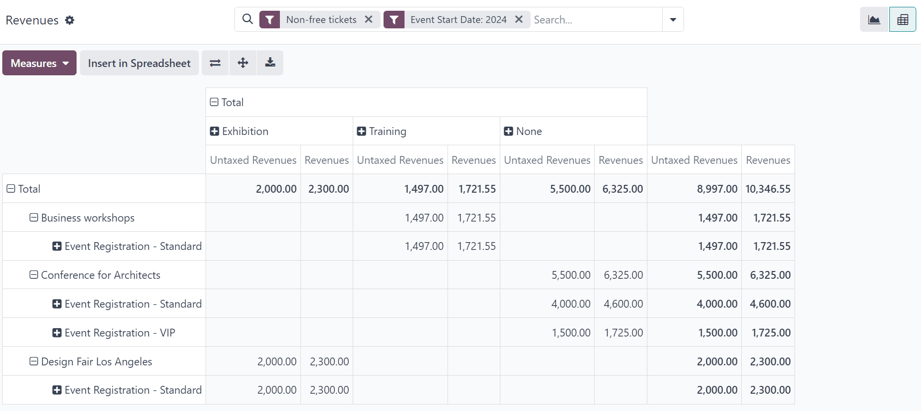
首先,导航至 ,点击右上角的 :guilabel:`(Pivot)`图标,切换到透视表视图。
保留搜索栏中的默认筛选器(非免费门票`和 :guilabel:`活动开始日期:(年))。
接下来,打开 度量 下拉菜单,取消选择 计数 选项,因为本报告只关注收入。
然后,点击列标题上方的 总计,并从下拉菜单中选择 活动类型。
有了这些配置,就可以按活动类型(以可扩展列的形式显示)显示活动产生的所有收入(及其相应的注册情况)。