报表中心
Reports in Odoo Helpdesk provide the opportunity to manage employee workloads, identify areas for improvement, and confirm if customer expectations are being met.
可用报告
Details about the reports available in Odoo Helpdesk can be found below. To view the different reports, go to , and select one of the following: Tickets Analysis, SLA Status Analysis, or Customer Ratings.
工单分析
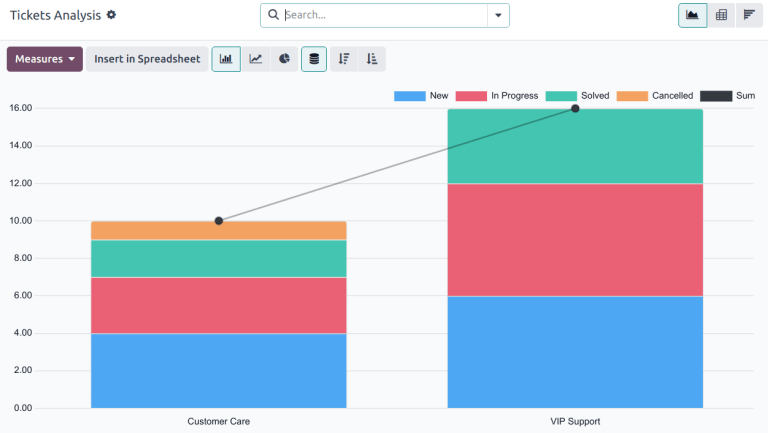
*工单分析*报告()提供数据库中每个客户支持工单的概览。
该报告有助于确定团队在哪些方面花费的时间最多,并帮助确定支持人员之间的工作量分配是否不均衡。默认报告计算每个团队的工单数量,并按阶段分组。
可以选择其他衡量标准来追踪工作流程中不同阶段花费时间最多的地方。要更改当前显示的报告所使用的衡量标准,或添加更多衡量标准,请单击 衡量标准 按钮,然后从下拉菜单中选择一个或多个选项:
响应平均小时数:从客户发送消息到支持团队做出响应之间的平均工作小时数。不包括工单处于折叠阶段时发送的消息。
开放时间:工单创建日期与关闭日期之间的小时数。如果工单上没有关闭日期,则使用当前日期。此指标不针对工作时间。
Hours Spent (Timesheets): number of Timesheet hours logged on a ticket. This measure is only available if Timesheets are enabled on a team, and the current user has the access rights to view them.
首次响应小时数:从收到票单之日到发送第一条消息之间的工作小时数。不包括工单到达某个阶段时自动发送的电子邮件。
Rating (1-5): number out of five to represent customer feedback (Dissatisfied = 1, Okay/Neutral = 3, Satisfied = 5).
销售订单剩余小时数:链接销售订单的剩余时间。
Working Hours to Assign: number of working hours between the date the ticket was created and when it was assigned to a team member.
Working Hours to Close: number of working hours between the date the ticket was created and the date it was closed.
Working Hours until SLA Deadline: number of working hours remaining to reach the last SLA deadline on a ticket.
计数:工单总数。
注解
工作时间 根据默认工作日历计算。要查看或更改工作日历,请进入 应用程序并选择 。
SLA状态分析
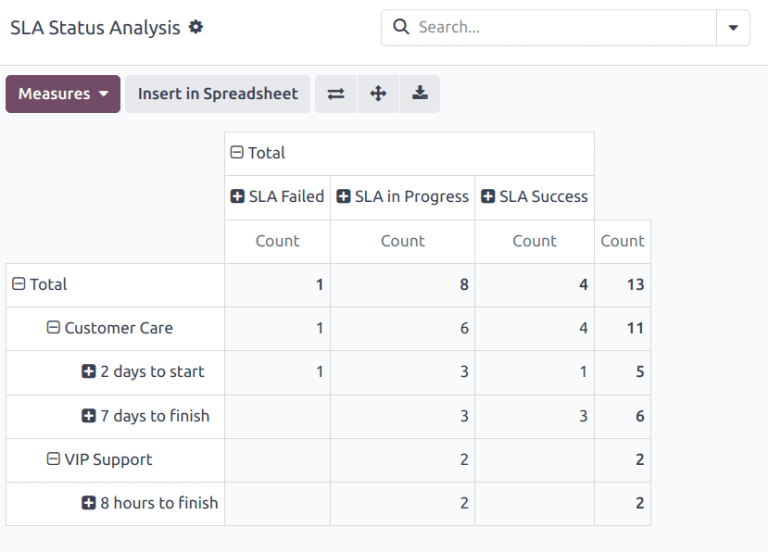
The SLA Status Analysis report () analyzes the performance of individual SLA (Service Level Agreement) policies.
By default, this report is filtered to show the number of SLAs failed, in progress, and the number that have been successful. The results are grouped by teams.
要更改当前显示的报告所使用的衡量标准,或添加更多衡量标准,请单击 衡量标准 按钮,然后从下拉菜单中选择一个或多个选项:
响应平均小时数:从客户发送消息到支持团队做出响应之间的平均工作小时数。不包括工单处于折叠阶段时发送的消息。
开放时间:工单创建日期与关闭日期之间的小时数。如果工单上没有关闭日期,则使用当前日期。此指标不针对工作时间。
Hours Spent (Timesheets): number of Timesheet hours logged on a ticket. This measure is only available if Timesheets are enabled on a team, and the current user has the access rights to view them.
首次响应小时数:从收到票单之日到发送第一条消息之间的工作小时数。不包括工单到达某个阶段时自动发送的电子邮件。
Number of SLA Failed: number of tickets that have failed at least one SLA.
Rating (1-5): number value representing customer feedback (Dissatisfied = 1, Okay/Neutral = 3, Satisfied = 5).
销售订单剩余小时数:链接销售订单的剩余时间。
Working Hours to Assign: number of working hours between the date the ticket was created and when it was assigned to a team member.
Working Hours to Close: number of working hours between the date the ticket was created and the date it was closed.
Working Hours to Reach SLA: number of working hours between the date the ticket was created and the date the SLA was satisfied.
计数:工单总数。
客户点评
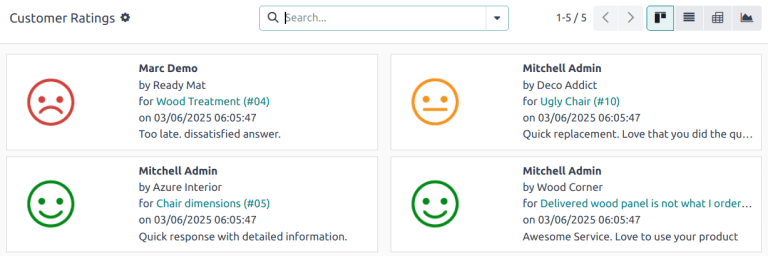
The Customer Ratings report () displays an overview of the ratings received on individual support tickets, as well as any additional comments submitted with the rating.
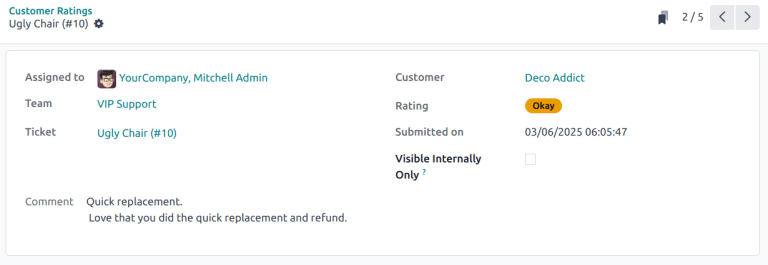
单击单个评分可查看客户提交的评分详情,包括原始工单的链接。
小技巧
On the rating’s details page, tick the Visible Internally Only checkbox to hide the rating from public and portal users.
The Customer Ratings report is displayed in a Kanban view by default, but can also be displayed in graph, list, or pivot view.
更多内容
用例
Assessing performance based on customer priority
The Tickets Analysis report can be used to evaluate the time it takes to address high-priority tickets compared to standard ones. This helps ensure that high-priority tickets are resolved promptly, and identifies any discrepancies in response times based on priority.
First, navigate to . Click Measures, then select Working Hours to Close. Click into the search bar, then under Group By, select Priority. Finally, under Filters, select Closed.
小技巧
The pivot view is also useful for this version of the report.
Monitoring SLA compliance over time
The SLA Status Analysis report can be used to track SLA compliance trends to identify periods with higher SLA breaches. SLA breaches happen when support teams fail to meet the response or resolution times promised in SLAs, leading to dissatisfied customers, potential financial penalties, and decreased team morale. Identifying these breaches is crucial for tracking real-time performance, uncovering patterns, and addressing root causes—like staffing issues or process inefficiencies.
First, navigate to . Click the (Graph) icon, then the (Line Chart) icon.
注解
While the SLA Status Analysis report defaults to the pivot view, the line chart view provides a better visual representation for this specific use case.
Click Measures, then select Number of SLAs Failed. Doing so ensures the data on the report shows only information for tickets that failed at least one SLA. Click into the search bar, then under Group By, select SLA Deadline, and select a time frame, either Month, Week, or Day. This option shows when the highest number of tickets with SLAs are failing, allowing the team to identify patterns, and prepare for potential issues.
小技巧
The time frame selected for this report may vary depending on a few factors, including the amount of tickets received on a regular basis, the number of SLAs enabled in the database, and the workload of the team. It is worth experimenting to see what option delivers the most insights.