预期利润分析
预期收入 是预计在某个日期(通常是当月月底)前成交的潜在客户的现金总值。
预期收入报告 汇集了销售管道中具有既定预期成交日期的所有有效销售线索,并比较销售团队在给定时间内的业绩表现。

By pulling a monthly expected revenue report, sales managers can see which team members are reaching their goals, and who may need additional assistance to close valuable deals.
创建预期收入报告
要创建预期收入报告,首先导航至 。这将打开 管道分析 仪表板。
重要
管道分析 仪表板默认在搜索栏中包含几个筛选器。在添加任何其他自定义筛选器之前,请先移除这些筛选器。
On the top-left of the report, click Measures, then select Expected Revenue from the drop-down menu.
在页面顶部,点击 搜索… 栏右侧的 🔻(朝下三角形)`图标,打开包含 :guilabel:`筛选器、分组方式 和 收藏 栏的下拉菜单。在 筛选器 列下,点击 添加自定义筛选器,弹出 添加自定义筛选器 窗口。
添加自定义过滤器
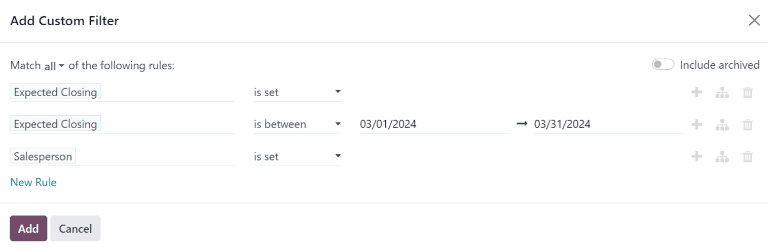
为了生成预期收入报告,需要针对以下条件创建筛选器:
Expected closing date: limits results to only include leads expected to close within a specific time frame.
Exclude unassigned leads: excludes leads without an assigned salesperson.
Specific sales teams: limits results to only include leads assigned to one or more sales teams. This filter is optional and should not be included if the report is intended for the entire company.
Add filter for expected closing date
在 添加自定义筛选器 弹出窗口中,点击新规则的第一个字段。在 搜索… 栏中键入 预计成交,或滚动以从列表中选择。点击第二个字段并选择 已设置。这将限制搜索结果只包括列出了预计结束日期的潜在客户。
Next, click the ➕ (plus) icon to the right of the rule to duplicate it.
小技巧
Using the ➕ (plus) icon makes it easy to add multiple rules based on the same filter.
In the second field of the new rule, select is between from the drop-down menu. This creates a set time frame during which the expected closing date must occur for leads to be included in the results.
Click in each date field, one at a time, and use the calendar popover window to add both a start and end date to the rule. This is usually the beginning and ending of the current month, or fiscal quarter.
排除未分配的潜在客户
After filtering for the expected closing date, add a New Rule. Then, click into the new
rule’s first field, and type Salesperson in the Search… bar, or scroll through the
list to select it. Click in the rule’s second field and select is set from the drop-down
menu. This excludes any results without an assigned salesperson.
Add a filter for sales teams
注解
此筛选器为可选项。要查看整个公司的结果,请**不要**添加此筛选器,并继续 查看结果。
要将报告结果限制为一个或多个销售团队,请点击 新规则。接下来,点击新规则的第一个字段,然后在 搜索… 栏中键入 销售团队,或滚动到列表中搜索以找到它。
In the rule’s second field, select is in from the drop-down menu. Selecting this operator limits results to the sales teams indicated in the next field.
Lastly, click into the third field, and either: make a selection from the complete list revealed in the popover menu, or type the first few characters of the specific sales team’s title to quickly find and select it as a parameter.
小技巧
Multiple teams can be added to the Sales Team rule, where each parameter is treated with an
“or” (e.g. “any”) operator in the search logic.
查看结果
在:guilabel:添加自定义筛选器`表单的顶部,有匹配:guilabel:`任意`或:guilabel:`所有`规则的选项。为了正确运行报告,只应包含符合以下所有筛选规则的记录。添加筛选器之前,请确保在此字段中选择 :guilabel:`全部。
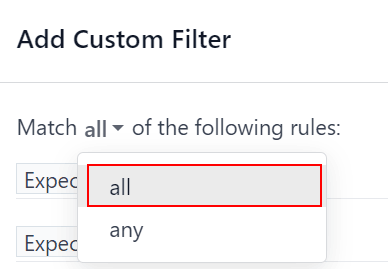
At the bottom of the Add Custom Filter form, click Add.
查看选项
查看预期收入报告得益于多种视图的使用。默认图表视图可用于确定哪些销售人员有望带来最多收入,而列表视图和透视视图则可提供有关具体交易的更多细节。
*图表视图*用于将数据可视化,有利于识别模式和趋势。
*条形图*用于展示数据在多个类别或多个销售人员之间的分布情况。
*折线图*有助于显示一段时间内的变化趋势。
*饼状图*适用于显示数据在少数类别或销售人员之间的分布或情况,特别是它们如何构成整体图片的有意义部分。
预期收入报告的默认视图是堆叠条形图。要切换到不同的图表视图,请点击报告左上角的图标之一。虽然折线图和条形图都可以使用堆叠视图,但饼状图不能使用。
图表视图图标依次为:条形图、折线图、饼状图、堆叠图。
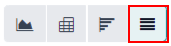
The list view provides a list of all leads that are expected to close by the designated date. Clicking on a lead in list view opens the record for detailed analysis, but many insights can be gleaned from the basic view.
To switch to the list view, click the ≣ (list) icon at the top-right of the report.
To add additional metrics to the report, click the additional options menu indicated by the toggle icon at the top-right of the list.
Clicking the toggle icon in list view opens the additional options menu.
Select any additional metrics from the drop-down menu to add them to the list view. Some options that may be useful are Expected Closing and Probability.
The pivot view arranges all leads that are expected to close by the designated date into a dynamic table.
To switch to the pivot view, click the Pivot icon at the top-right of the report.
When the pivot view is selected for this report, the X-axis lists the stages in the pipeline, while the Y-axis defaults to group the results by their creation date. To switch these groupings, click the flip access icon (⇄) at the top of the report.
To add additional measures to the report, click the Measures button at the top-left of the report. Select any additional metrics from the drop-down menu.
要在数据透视图的行或列中添加组,请单击 ➖ (加号) 旁边的 总计,然后选择其中一个组。要删除一个组,请单击 :guilabel:`➖(减号)`并取消选择相应选项。
Click Insert in Spreadsheet to add the pivot view into an editable spreadsheet format within the Dashboards app. If the Odoo Documents app is installed, the report can be inserted into a blank or existing spreadsheet, and exported.